ACMO Dashboard
The AP and AR Operations Dashboard provides a consolidated view of billing activity, payment exposure, operational throughput, workload distribution, and automation performance. It enables finance and operations teams to monitor system health and financial commitments without navigating detailed transactional reports.
System Overview
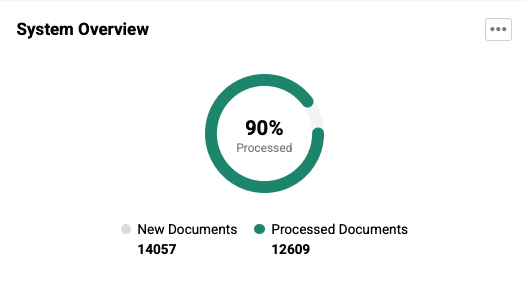
The System Overview summarises total document inflow and processing activity across bills and remittances.
What this shows
- Total documents currently in the system
- Documents successfully processed
- Newly received and processed bills
- Newly received and processed remittances
Why it matters
This section provides an immediate snapshot of transaction growth and processing stability across the platform.
How to use it
Use this view to quickly determine whether operational throughput is keeping pace with incoming financial activity and whether processing backlogs may be developing.
Planned vs Unplanned
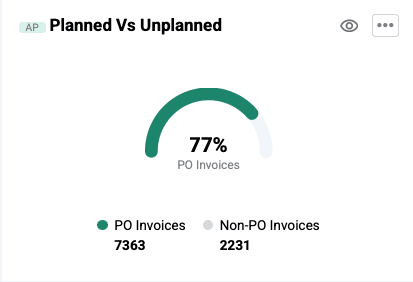
This report compares purchase order (PO) invoices with non-PO invoices entering the system.
What this shows
- Planned invoices (PO-based bills raised against approved purchase orders)
- Unplanned invoices (non-PO bills received without prior procurement reference)
Why it matters
PO invoices typically reflect pre-approved and expected expenditure, whereas non-PO invoices may represent unplanned financial commitments.
How to use it
Monitor the proportion of non-PO invoices to identify uncontrolled or unforecasted spending entering the system.
Exception Report
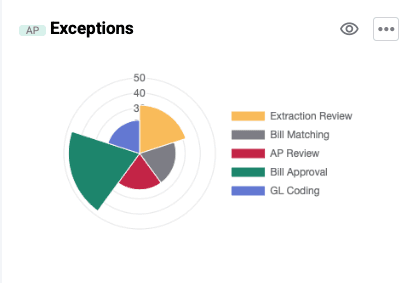
The Exception Report highlights workflow items requiring manual intervention.
What this shows
- Extraction review tasks
- Matching discrepancies
- AP review queues
- Approval delays
- Coding exceptions
Why it matters
Exception-heavy workflows may indicate document quality issues, authorization delays, or purchase order mismatches.
How to use it
Regularly reviewing this section helps identify operational bottlenecks and enables timely corrective action.
Spending by Supplier
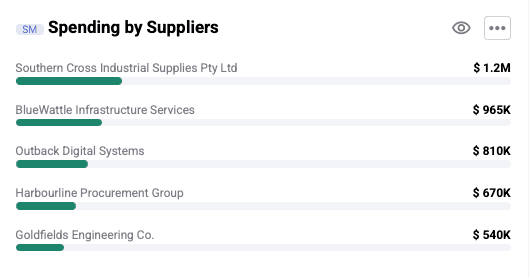
This report visualizes supplier-wise expenditure distribution.
What this shows
- Supplier contribution to total spend
- Vendor concentration patterns
Why it matters
Excessive spend concentration among a limited number of vendors may increase supplier dependency risk.
How to use it
Use this report to support vendor diversification strategies and evaluate procurement exposure.
DSO (Days Sales Outstanding)
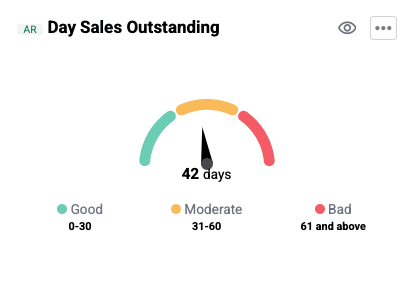
This metric represents the average number of days required to collect receivables.
What this shows
- Payment realization timelines across outstanding receivables
Why it matters
Lower DSO improves liquidity and reflects efficient receivables management.
How to use it
Track upward trends in DSO to detect potential collection delays and assess working capital performance.
Bills Due (Count and Amount)
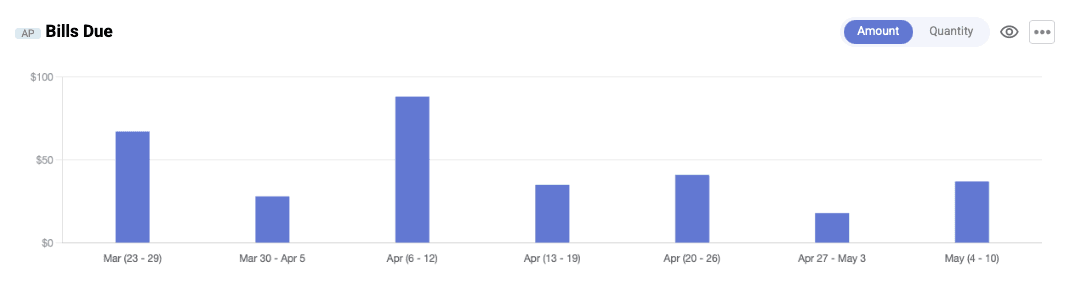
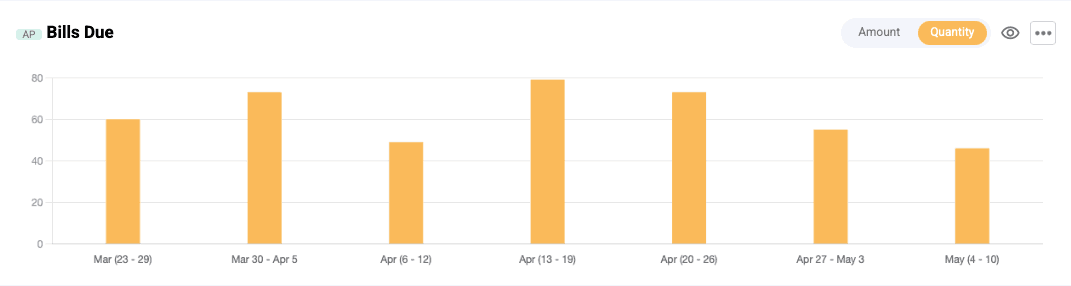
This section presents upcoming payment obligations in both volume and value terms.
What this shows
- Number of bills approaching due date
- Total payable value of due bills
Why it matters
Rising payable obligations may expose short-term cash flow risks.
How to use it
Use this section for payment planning and near-term financial commitment tracking.
Bills Processing (Input vs Output)
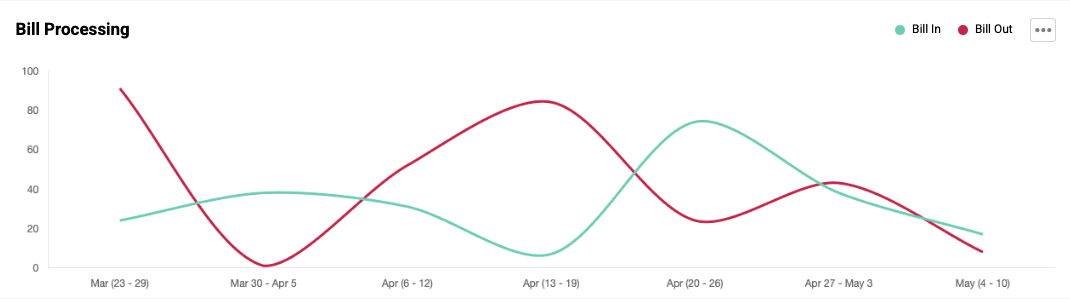
This report compares incoming billing volume with successfully processed bills.
What this shows
- Bills entering the system
- Bills cleared through processing workflows
Why it matters
Processing imbalance between input and output may signal operational backlog formation.
How to use it
Track alignment between incoming and processed bills to evaluate throughput efficiency.
Allocation Summary
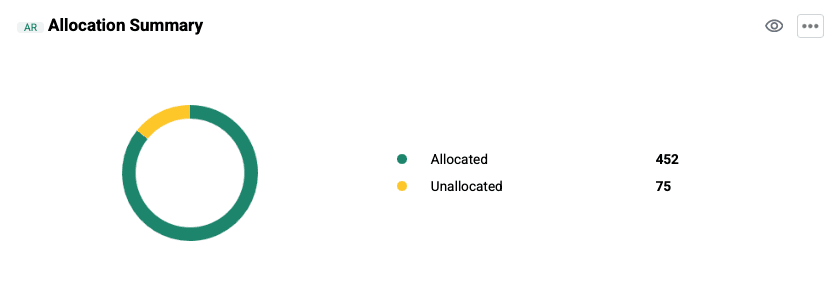
This report tracks reconciliation progress for remittance-related allocations.
What this shows
- Pending allocations
- Completed allocations
Why it matters
Delayed allocation activity may affect financial record accuracy.
How to use it
Monitor pending allocations to ensure reconciliation processes remain up to date.
Straight Through Rate
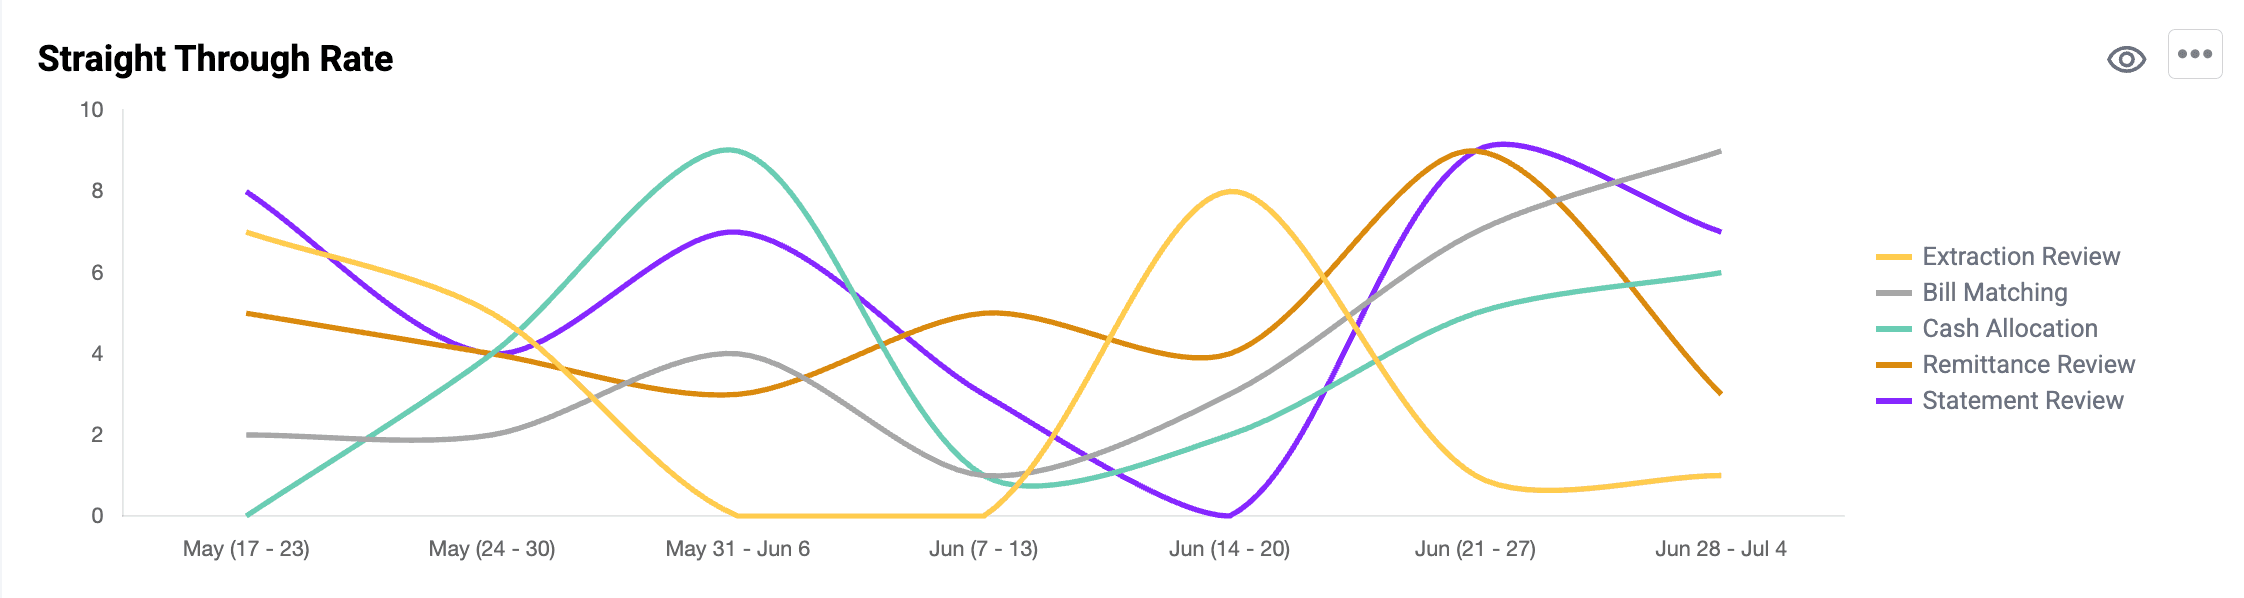
The STP Report reflects automation-driven task processing over time.
What this shows
- Tasks completed through automated workflows
- Tasks requiring manual review
Why it matters
Reduced automation may indicate declining workflow efficiency or process exceptions.
How to use it
Use this section to monitor automation effectiveness and identify improvement opportunities.
Throughput Snapshot
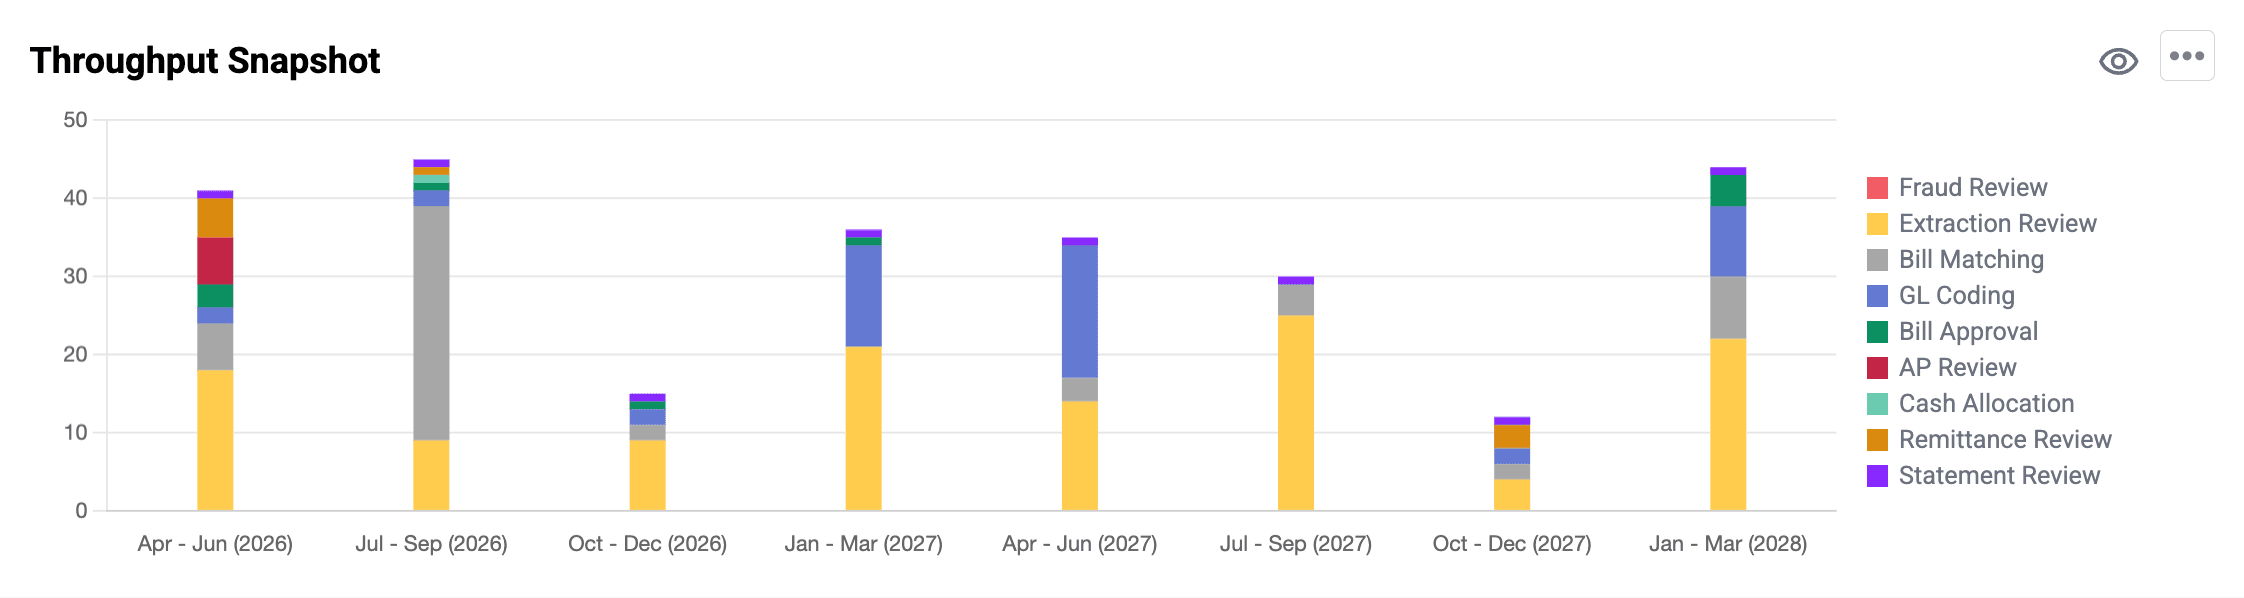
This report presents workload distribution across operational task categories.
What this shows
- Extraction review
- Matching
- Coding
- Approval
- AP review
- Remittance review
- Cash allocation
Why it matters
Imbalanced workload distribution may impact team productivity and turnaround time.
How to use it
Use this view to evaluate operational effort allocation and identify performance trends.
Dashboard Usage Guidelines
Operational Monitoring
Review Exception Report and Allocation Summary to identify daily workflow issues.
Performance Monitoring
Track Bills Processing and STP metrics to evaluate throughput and automation levels.
Financial Oversight
Monitor DSO, Spending by Supplier, and Planned vs Unplanned Bills for strategic planning.
Summary
The Finance Operations Dashboard enables:
- Monitoring of processing throughput
- Visibility into financial obligations
- Evaluation of automation performance
- Analysis of vendor expenditure
- Tracking of workload distribution
It supports informed operational and financial decision-making through structured performance insights.